
SERIES TWO – MEAT PRODUCTION
Reference to red meat production normally includes meat produced from cattle, sheep, pigs and goat. In the following charts unless indicated I have used red meat production as a reference to only cattle and sheep. Red meat production doesn’t include buffalo, deer, poultry, chickens or duck or other animals such as kangaroo, camel, horse or rabbit.
What does Australia produce utilising production of cattle and sheep?
The following charts I have tried to source as far back as I could, the meat production charts are not necessarily a true representation of all meat produced as they only record the meat suitable for human consumption, not including offal. They don’t include condemned animals, pet- food meat produced or animals boiled down for tallow which through to approximately late 80’s would have been significant in numbers. Tallow is animal fat and was used for candles and cooking up until the 1990’s but is now mostly replaced by vegetable oils. Tallow can be used to make biofuel; this is often recycled at abattoir sites for their own energy purposes.
Figure 1. Australian red meat production – this is a graph to illustrate the volume of edible product in meat produced by the slaughter of cattle, sheep and pigs. This production is through Australian abattoirs. The total red meat is the combined total of all products.

Figure 1 – Australian red meat production of cattle, sheep and pigs 1973 – 2012
Australian livestock are also sent overseas live.
Figure 2 – Australian live cattle exported – This is the volume of all types of cattle exported from Australia.
 Figure 2 – Australian live cattle exported. 1950/51 – 2011/12.
Figure 3 – Australian live sheep exported – this is the volume of all types of sheep exported from Australia.
 Figure 3 – Australian live sheep exported 1950/51 – 2011/12
The basis from which both Australian meat production and live export is drawn are the national herds.
I haven’t been able to find consistently long records of only beef herd records therefore all the graphs for herds include a dairy herd component, at 2011/2012 this is about 1.63M head. Even though veal (calves) is predominantly from dairy herd supply, mature animals slaughtered from dairy herds would be included in beef statistics.
I will concentrate on live export in the next series.
Cattle meat production consists of
- Mature animals that produce beef and are predominately sourced from beef herds.
- Calves that produce veal and are predominately sourced from dairy herds.
Figure 4 – Australian Cattle beef production. Most years (except prior to 1985) the Mature animal component of beef production is 96 – 99% of the total volume of the cattle herd meat production.

Figure 4 – Australian Beef production. 1973 – 2013 (June)
Figure 5 – Australian sheep meat production.

Figure 5 – Australian sheep meat production 1973 – 2012
Live export animal types consists of –
- Slaughter – these animals may be slaughtered soon after arrival at destination or fed for a period in the import country then slaughtered, they may consist of female and male animals. Generally their lifespan in the importing country is very short to a few months.
- Dairy – These are animals mainly sourced from southern regions for milking herds in importing countries, they are generally kept for a number of years as production animals.
- Breeders – both dairy and beef cattle, both male and female, that are intended to be kept for long periods specifically for their genetics and breeding capabilities.
Figure 6 – Types of animals live exported. Breakdown of these figures for groups was only available since 2005

Figure 6 – Australian cattle live exports
Where Australian meat production is sent
Figure 7 – Australian Beef industries production in total showing the volume which is exported as frozen and chilled product of both beef (mature animals) and veal.
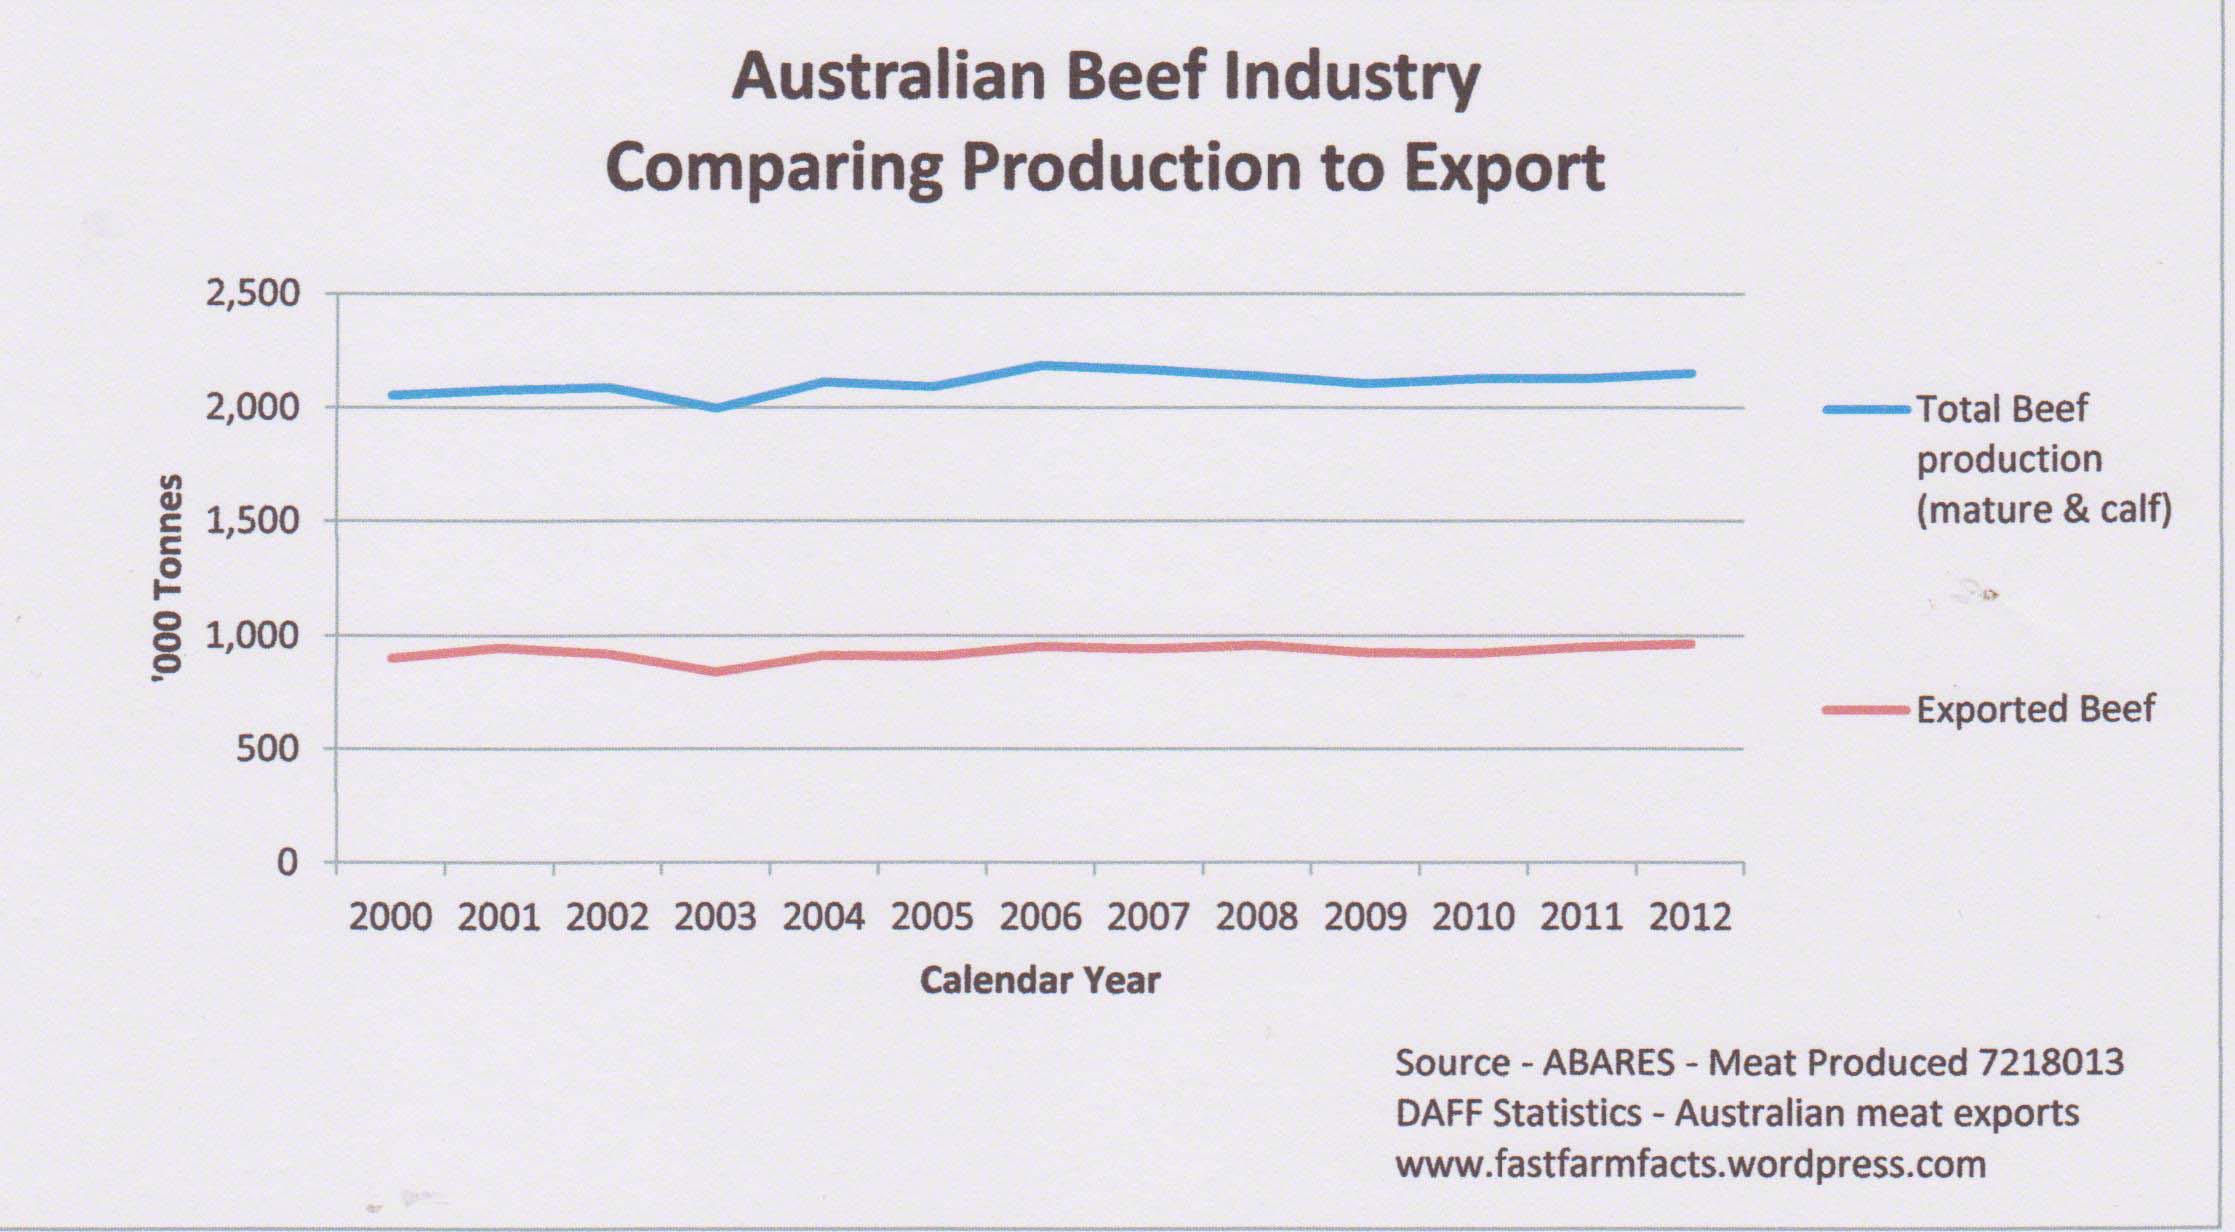
Figure 7 – Australian beef production compared to export. 2000 – 2012
Figure 8 – Australian sheep industries production in total showing the volume which is exported as frozen and chilled product of both sheep (mature animals) and lamb.
 Figure 8 – Australian sheepmeat production 2000 – 2012.
Figure 9 – Australian domestic meat consumption. This graph illustrates the average consumption per person in a year of kilograms of meat. I have included poultry in this graph as it is important to realise the loss of market that has occured in the red meat sector of beef and sheep to the gain of poultry and pig.
 Figure 9. Australian persons average consumption of meat. 1971 – 2011
